8.2 KiB
Sentinel Example
项目说明
本项目演示如何使用 Sentinel starter 完成 Spring Cloud 应用的限流管理。
Sentinel 是阿里巴巴开源的分布式系统的流量防卫组件,Sentinel 把流量作为切入点,从流量控制,熔断降级,系统负载保护等多个维度保护服务的稳定性。
示例
如何接入
在启动示例进行演示之前,我们先了解一下如何接入 Sentinel。 注意 本章节只是为了便于您理解接入方式,本示例代码中已经完成接入工作,您无需再进行修改。
-
首先,修改 pom.xml 文件,引入 Sentinel starter。
<dependency> <groupId>org.springframework.cloud</groupId> <artifactId>spring-cloud-starter-sentinel</artifactId> </dependency> -
接入限流埋点
-
HTTP埋点 Sentinel starter 默认为所有的 HTTP 服务提供了限流埋点,如果只想对 HTTP 服务进行限流,那么只需要引入依赖,无需修改代码。
-
自定义埋点 如果需要对某个特定的方法进行限流或降级,可以通过 @EnableSentinel 来完成限流的埋点,示例代码如下
 @EnableSentinel("resource")
 public String hello() {
 	return "Hello";
 }
-
-
配置限流规则
Sentinel提供了两种配置限流规则的方式,代码配置 和 控制台配置,本示例使用的方式为通过控制台配置。
-
通过代码来实现限流规则的配置。一个简单的限流规则配置示例代码如下,更多限流规则配置详情请参考 Sentinel 文档。
List<FlowRule> rules = new ArrayList<FlowRule>(); FlowRule rule = new FlowRule(); rule.setResource(str); // set limit qps to 10 rule.setCount(10); rule.setGrade(RuleConstant.FLOW_GRADE_QPS); rule.setLimitApp("default"); rules.add(rule); FlowRuleManager.loadRules(rules); -
通过控制台进行限流规则配置请参考文章后面的图文说明。
-
启动 Sentinel 控制台
-
首先需要获取 Sentinel 控制台,支持直接下载和源码构建两种方式。
- 直接下载:下载 Sentinel 控制台
- 源码构建:进入 Sentinel Github 项目页面,将代码 git clone 到本地自行编译打包,参考此文档。
-
启动控制台,执行 Java 命令
java -jar sentinel-dashboard.jar完成 Sentinel 控制台的启动。 控制台默认的监听端口为 8080。Sentinel 控制台使用 Spring Boot 编程模型开发,如果需要指定其他端口,请使用 Spring Boot 容器配置的标准方式,详情请参考 Spring Boot 文档。
应用启动
-
增加配置,在应用的 /src/main/resources/application.properties 中添加基本配置信息
spring.application.name=sentinel-example server.port=18083 spring.cloud.sentinel.dashboard=localhost:8080 -
启动应用,支持 IDE 直接启动和编译打包后启动。
- IDE直接启动:找到主类
ServiceApplication,执行 main 方法启动应用。 - 打包编译后启动:首先执行
mvn clean package将工程编译打包,然后执行java -jar sentinel-example.jar启动应用。
- IDE直接启动:找到主类
调用服务
使用 curl 分别调用两个 URL,可以看到访问成功。

配置限流规则并验证
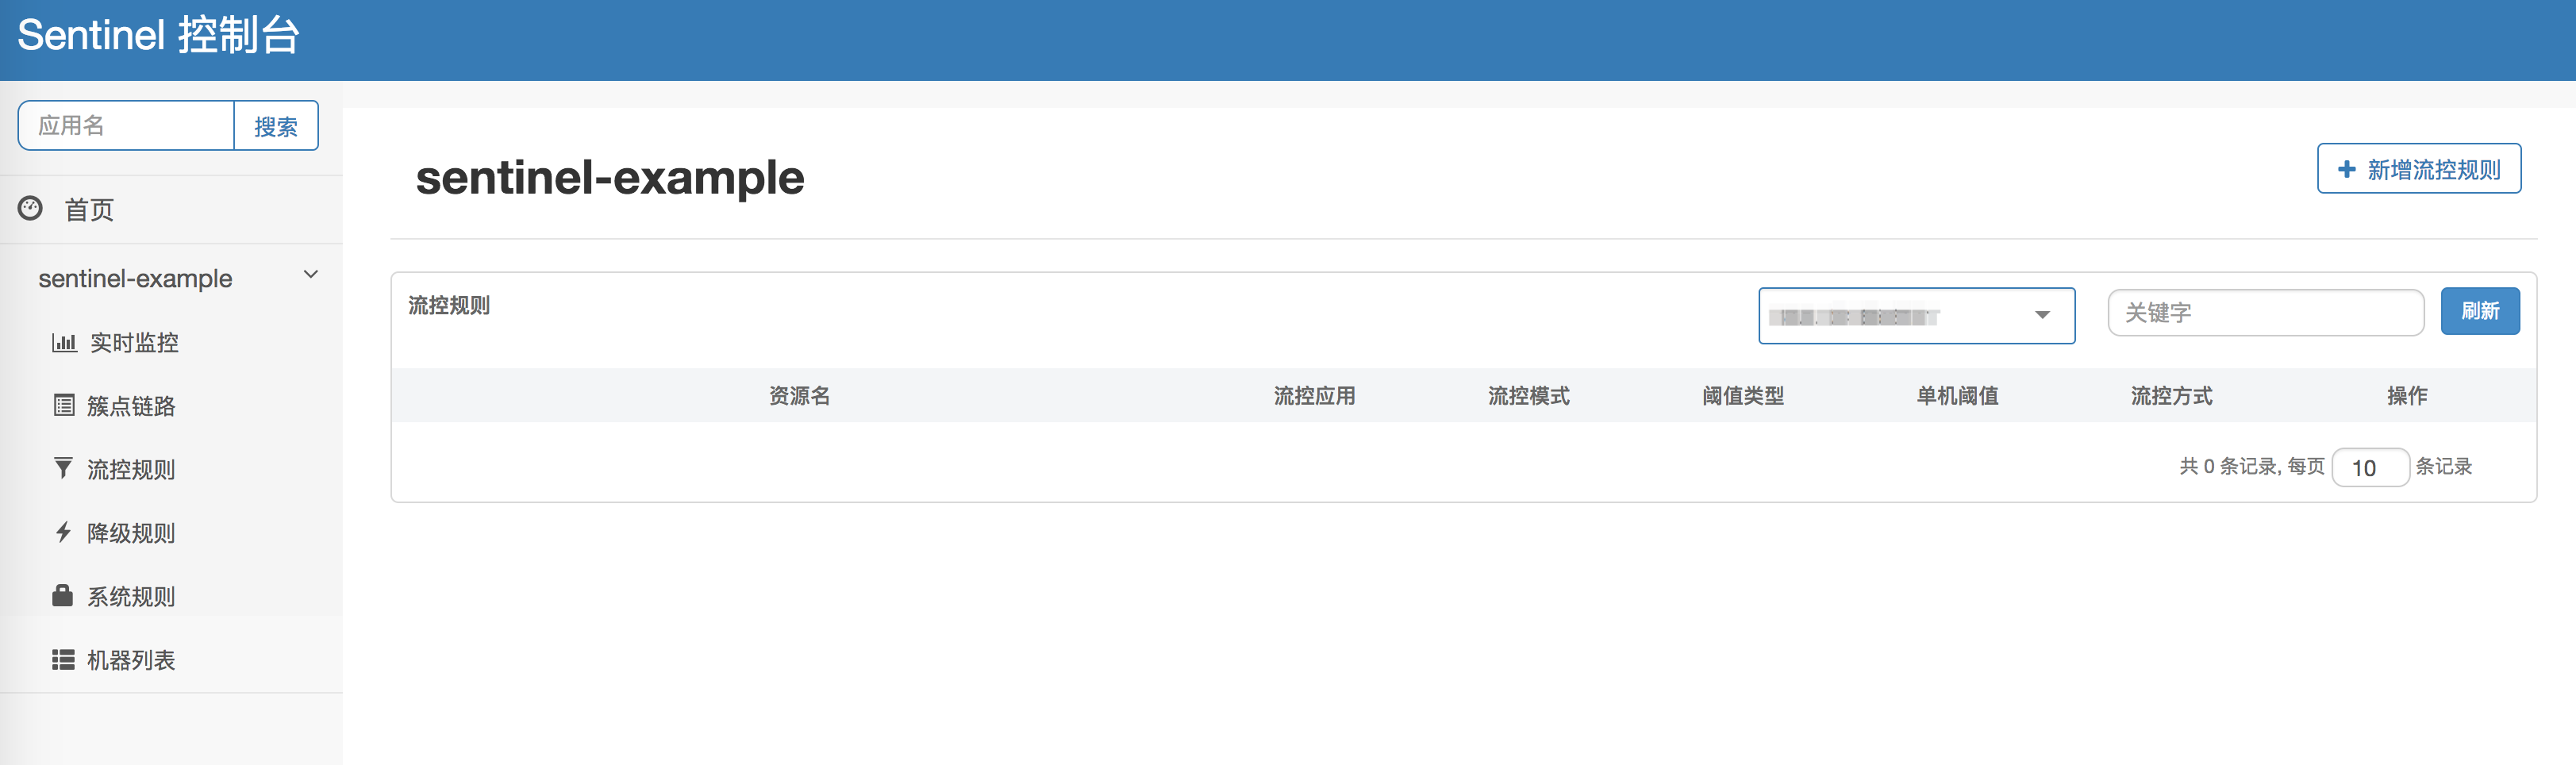
- 访问 http://localhost:8080 页面,可以在左侧看到 Sentinel-Example 应用已经注册到了控制台,单击 流控规则 ,可以看到目前的流控规则为空。 注意 如果您在控制台没有找到应用,请调用一下进行了 Sentinel 埋点的 URL 或方法,因为 Sentinel 使用了 lazy load 策略
- 配置 URL 限流规则:点击新增流控规则,资源名填写需要限流的 URL 相对路径,单机阈值选择需要限流的阈值,点击新增进行确认。(为了便于演示效果,这里将值设置成了 1)。

- 配置自定义限流规则:点击新增流控规则,资源名填写 @EnableSentinel 注解 value 字段的值,单机阈值选择需要限流的阈值,点击新增进行确认。(为了便于演示效果,这里将值设置成了 1)。

- 访问 URL,当 QPS 超过 1 时,可以看到限流效果如下。


自定义限流处理逻辑
-
URL 限流触发后默认处理逻辑是,直接返回 "Blocked by Sentinel (flow limiting)"。 如果需要自定义处理逻辑,实现的方式如下
public class CustomUrlBlockHandler implements UrlBlockHandler { @Override public void blocked(HttpServletRequest httpServletRequest, HttpServletResponse httpServletResponse) throws IOException { // todo add your logic } } WebCallbackManager.setUrlBlockHandler(new CustomUrlBlockHandler()); -
自定义限流触发后,默认的处理逻辑是抛出异常。 如果需要自定义处理逻辑,需要实现 SentinelExceptionHandler 接口,将其注册到 HandlerUtil 中,并在 @EnableSentinel 注解中 handler 字段进行指定。示例实现如下
 public class CustomBlockHandler implements SentinelBlockHandler {
 	@Override
 	public Object handler(BlockException e) {
 		//todo add your logic
 		return null;
 	}
 }

 HandlerUtil.addHandler("myhandler", new CustomBlockHandler());


 @EnableSentinel(value = "resource",handler = "myhandler")
 public String hello() {
 	return "Hello";
 }
Endpoint 信息查看
Spring Boot 应用支持通过 Endpoint 来暴露相关信息,Sentinel Starter 也支持这一点。
在使用之前需要在 maven 中添加 spring-boot-starter-actuator依赖,并在配置中允许 Endpoints 的访问。
- Spring Boot1.x 中添加配置 management.security.enabled=false
- Spring Boot2.x 中添加配置 management.endpoints.web.exposure.include=*
Spring Boot1.x 可以通过访问 http://127.0.0.1:18083/sentinel 来查看 Sentinel Endpoint 的信息。Spring Boot2.x 可以通过访问 http://127.0.0.1:18083/acutator/sentinel 来访问。

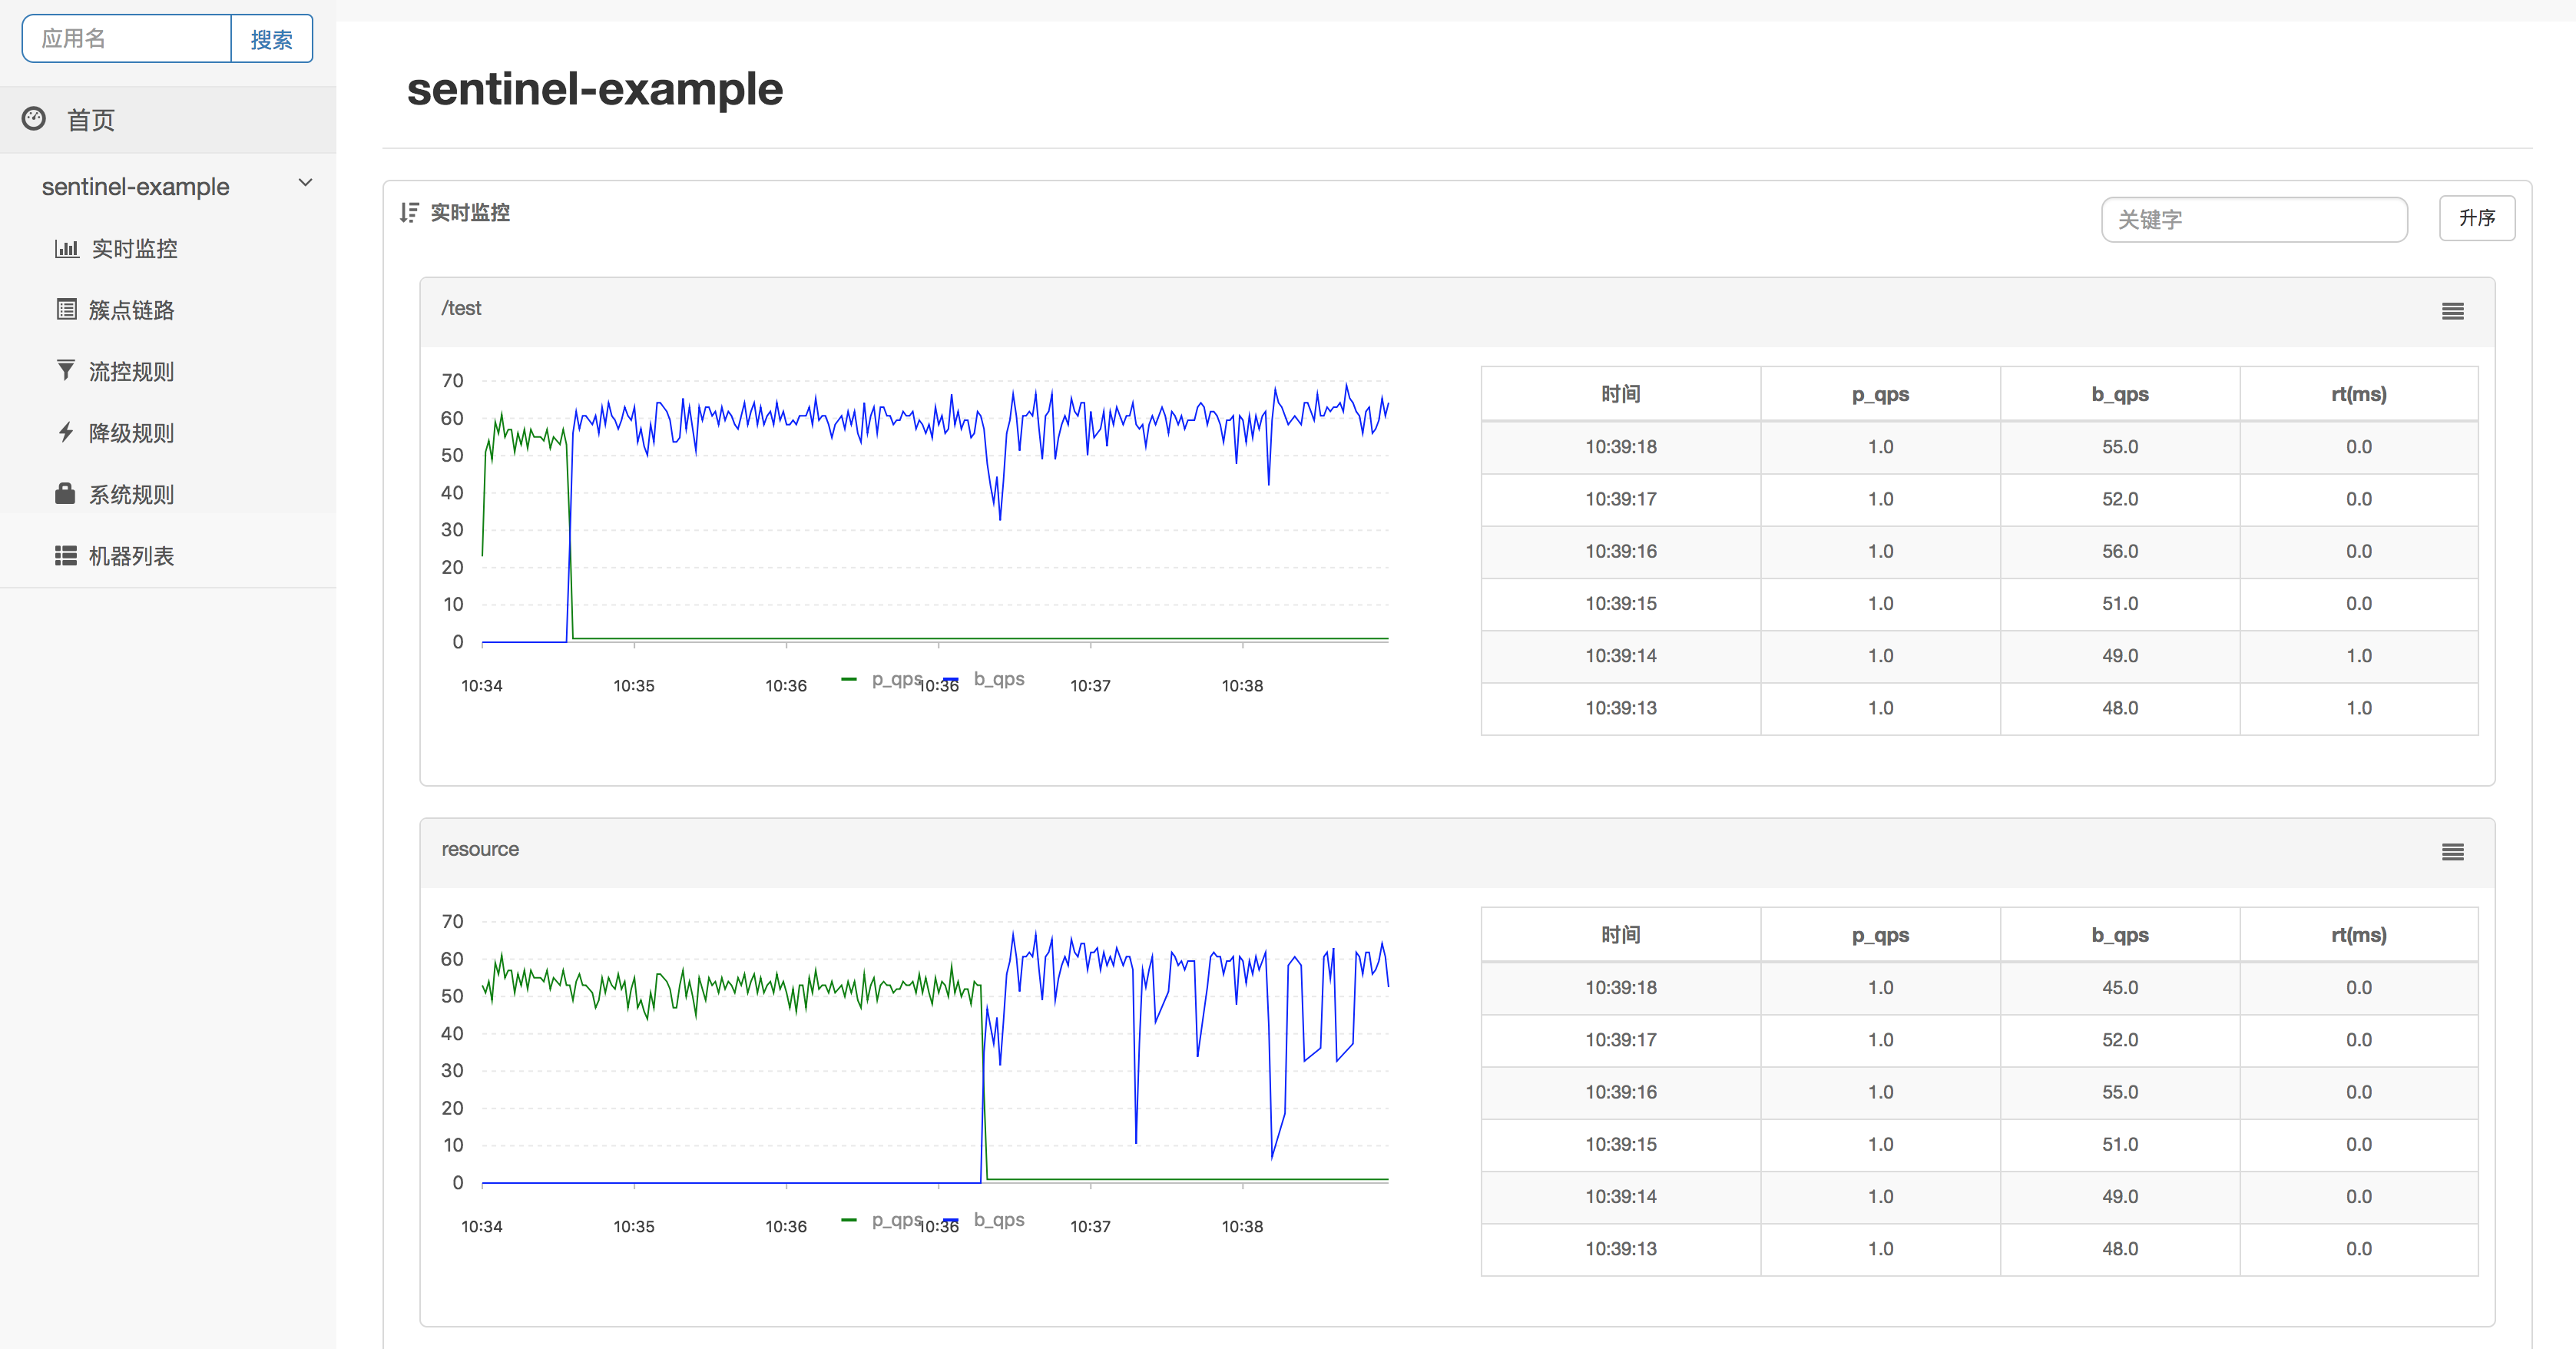
查看实时监控
Sentinel 控制台支持实时监控查看,您可以通过 Sentinel 控制台查看各链路的请求的通过数和被限流数等信息。 其中 p_qps 为通过(pase) 流控的 QPS,b_qps 为被限流 (block) 的 QPS。
More
Sentinel 是一款功能强大的中间件,从流量控制,熔断降级,系统负载保护等多个维度保护服务的稳定性。此 Demo 仅演示了 使用 Sentinel 作为限流工具的使用,更多 Sentinel 相关的信息,请参考 Sentinel 项目。
如果您对 spring cloud sentinel starter 有任何建议或想法,欢迎在 issue 中或者通过其他社区渠道向我们提出。